
Troubleshooting
Reading the Log Page: Find the Fault in Three Minutes
The instinct when something breaks is to reinstall. In practice the log page tells you which step failed in about thirty seconds — provided you know what to look at.
Set the log level first
The default Info level records only key events; Debug is far more detailed and is what you want while investigating. The level lives in the Clash settings and takes effect immediately. Put it back afterwards — Debug left on writes to disk continuously.
SponsoredWhere does the subscription link come from?Our partner provider gives you 1 GB of high-speed Hong Kong data at signup — import it in one click.Get high-speed nodesHow to read one line
A proxy log line is roughly: protocol → destination → matched rule → proxy group used. Each part answers a question:
- Destination looks wrong — name resolution is misbehaving, see DNS settings;
- Matched rule isn't the one you wanted — that's rule ordering, see rule providers;
- Right rule but it went DIRECT — check what the group itself is set to, see proxy groups.
Errors you'll actually meet
connection refused— nothing is listening on that port, or the node is down;i/o timeout— it connected but nothing came back: interfered route or an overloaded node;context deadline exceeded— a timeout, most often DNS resolution stalling;- A parse error at startup is a malformed config file, not a network problem at all.
When your request isn't in the log
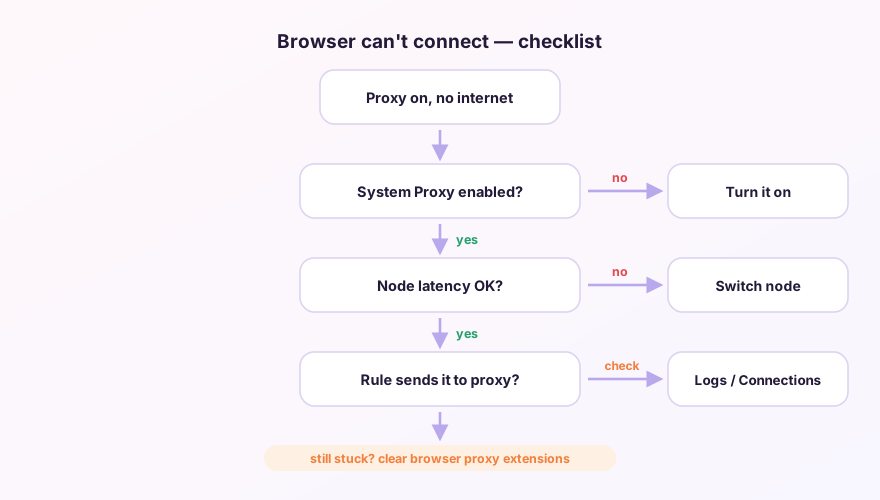
If you click around and the log doesn't move, the traffic never reached the core. Either the system proxy isn't applied, or that program ignores it — test both, and compare against system proxy vs TUN. The wider checklist is in common errors.
Before pasting logs into a GitHub issue, strip subscription URLs and provider names out of node labels — both show up verbatim in log lines.
Windows 64-bit installer · v2.5.1 · free & open source